p19h947e0rb2b13ak15l1al7hbr6.jpg
The Equal Employment Opportunity Commission is charged with enforcing six federal laws including, the Equal Pay Act, Age Discrimination in Employment Act and the Americans with Disabilities Act. While the scope of six laws may seem small, the number of EEOC charges in 2014 came in at just under 89,000. And when it comes to certain states, EEOC charges are through the roof. According to EEOC data, the following states top the charts for the most number of EEOC charges last year.

[Image: Fotolia]
p19h947e131auc1spi189d1khttnq7.jpg

10. Virginia

Total number of EEOC Charges: 3,051
Percentage of total U.S. charges: 3.4%

[Image: Fotolia]
p19h947e141uth1b69ucs64hle38.jpg

9. Tennessee

Total number of EEOC charges: 3,221
Percentage of total U.S. charges: 3.6%

[Image: Fotolia]
p19h947e14ckc5u01gj71vpnbsb9.jpg

8. New York

Total number of EEOC charges: 3,611
Percentage of total U.S. charges: 4.1%

[Image: Fotolia]
p19h947e151dfg85210ta6066mda.jpg

7. North Carolina

Total number of EEOC charges: 4,017
Percentage of total U.S. charges: 4.5%

[Image: Fotolia]
p19h947e15165ijurn0rkg0lanb.jpg

6. Pennsylvania

Total number of EEOC charges: 4,045
Percentage of total U.S. charges: 4.6%

[Image: Fotolia]
p19h947e1611mprds1cv01rmt1270d.jpg

5. Illinois

Total number of EEOC charges: 4,487
Percentage of total U.S. charges: 5.1%

[Image: Fotolia]
p19h947e17kfn1pu91qqorsk1aine.jpg

4. Georgia

Total number of EEOC charges: 4,820
Percentage of total U.S. charges: 5.4%

[Image: Fotolia]
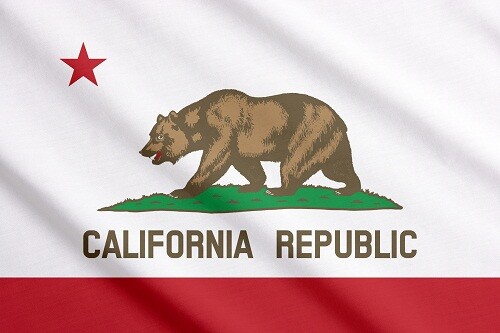
p19h947e176gk1mrkkbipqs19vff.jpg

3. California

Total number of EEOC charges: 6,363
Percentage of total U.S. charges: 7.2%

[Image: Fotolia]
p19h947e231pce1qt417gc1e39p87g.jpg

2. Florida

Total number of EEOC charges: 7,528
Percentage of total U.S. charges: 8.5%

[Image: Fotolia]
p19h947e2411du11re1c3sa7o16oth.jpg

1. Texas

Total number of EEOC charges: 8,035
Percentage of total U.S. charges: 9.1%

[Image: Fotolia]
p19h947e1512vg7o81avg12d912vac.jpg

EEOC facts

Top three 2014 charge types*:
Retaliation: 37,955 (42.8%)
Race: 31,073 (35%)
Sex: 26,027 (29.3%)

*The number for total charges reflects the number of individual charge filings. Because individuals often file charges claiming multiple types of discrimination, the number of total charges for any given fiscal year will be less than the total of the 10 types of discrimination listed.

[Image: Fotolia]
MORE FROM EMPLOYEE BENEFIT NEWS